

Residual Current Transformer Company Checklist for Optimal Electrical Protection
2026-08-20
When it comes to safeguarding electrical systems from dangerous leakage currents, the role of a residual current transformer cannot be overstated. Yet choosing the right partner from a sea of suppliers remains a challenge many engineers face. This checklist from Xiasen cuts through the noise, revealing the non-negotiable criteria that separate a trusted residual current transformer company from the rest. If optimal protection is your end game, read on to see which boxes truly matter.
Match the Residual Current Range to the Real Fault Profile
Treating the rated residual operating current of a protection device as a fixed trip point is a common mistake. Real faults rarely produce a clean, textbook sine wave at exactly that amplitude. The actual residual current profile depends on the fault path impedance, the type of load, the supply harmonics, and even the point in the voltage cycle where the fault occurs. What you get in the field is often a distorted waveform with peaks well above the rms value, a pulsing DC component, or high-frequency noise riding on the fundamental. Matching the residual current range means looking at the full shape and magnitude spectrum of the fault signal, not just one number on a datasheet.
A practical approach starts with the connected equipment. Loads like variable speed drives, switch-mode power supplies, and single-phase rectifiers can generate smooth DC residual currents under certain fault conditions. An AC-type RCD simply will not react to those. You need to know whether the possible fault current is sinusoidal AC, pulsating DC, or smooth DC, and then choose a device type—A, F, or B—that is designed to detect that specific range and waveform. At the same time, compare the expected peak values against the device's response curve. A residual current that briefly spikes above the rated trip level may not cause a trip if the duration is too short, while a sustained lower-level current might eventually trigger a delayed action.
Field verification closes the loop. Instead of relying only on theoretical calculations, use a residual current recorder or a test instrument that can capture the actual waveform during staged or naturally occurring faults. Overlay that recorded profile with the RCD's tripping characteristic. Pay attention to how the waveform changes with load, temperature, aging of insulation, and supply voltage fluctuations. A range that works at first installation may shift over time. The goal is to select a residual current operating range that stays within the device's reliable detection zone across all realistic fault scenarios, while still allowing normal leakage current to pass without nuisance tripping.
Question Every Core Material Claim with a Saturation Curve
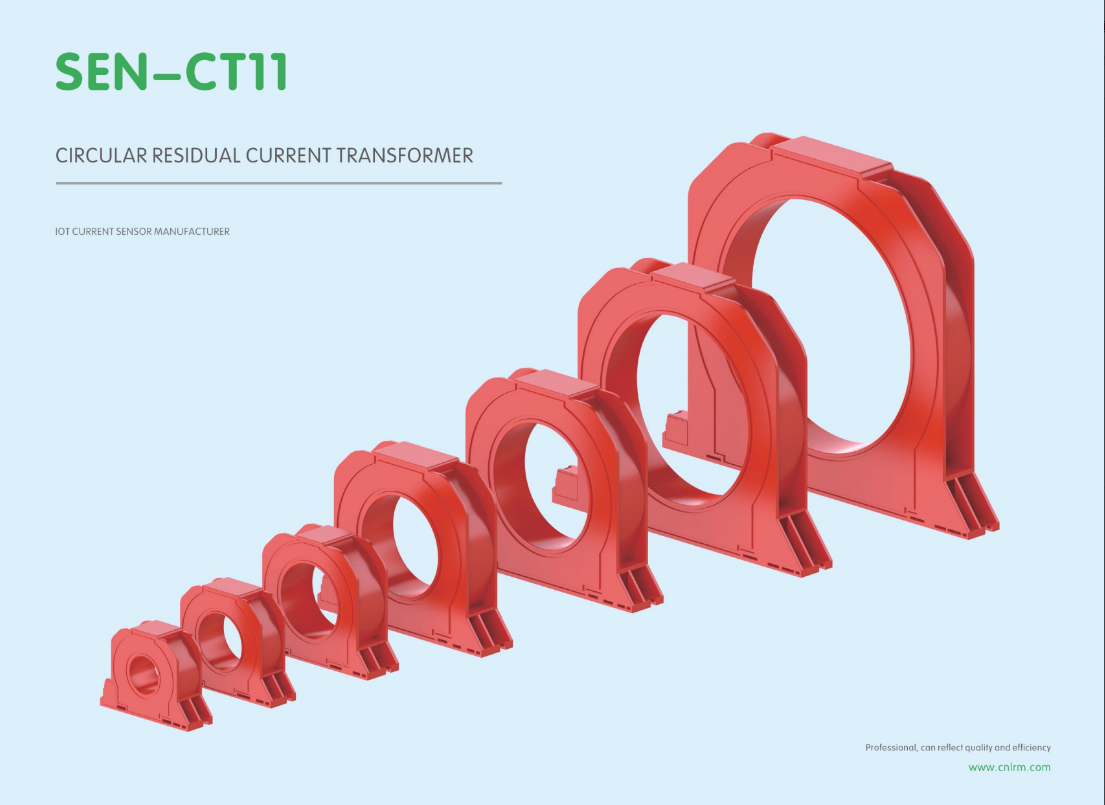
A single data point on a material datasheet rarely tells the whole story. When a supplier or a research paper claims that a core material delivers exceptional performance, the first thing to ask for is a full saturation curve under realistic operating conditions. Magnetic cores are a classic example. A vendor might report permeability or flux density at one convenient field strength, but without the saturation curve you cannot see how quickly the material enters the nonlinear region, where inductance collapses, losses spike, and your converter starts misbehaving. The curve exposes the real usable range, not the best-case number printed in bold.
Saturation curves also reveal the shape of the material's response, which determines the size of your safe operating window. If the knee of the curve sits far below your expected peak current or field, the material will saturate during normal operation, leading to overheating or outright failure. This applies beyond magnetics. In adsorption, catalysis, or battery electrodes, a saturation curve shows whether the material approaches its maximum capacity gradually or hits a hard ceiling early, and at what point additional driving force yields diminishing returns. Ignoring that curve means designing on a hope rather than a measured limit.
Make it a habit: whenever you evaluate a core material, request the saturation curve measured across the full range of your operating conditions, not just room temperature and ideal excitation. Temperature, frequency, and mechanical stress can shift the saturation point significantly, and a material that looks linear in a lab bench test may saturate prematurely inside a hot enclosure. The curve is not a formality; it is the difference between a component that works on paper and one that survives in the field.
Test Accuracy Under the Loads You Actually Run, Not Ideal Ones
Most teams validate accuracy on a quiet staging box with a single user and a pre-warmed cache. That tells you almost nothing about how the system behaves at 2 a.m. when batch jobs collide with user traffic, or when a popular item suddenly drives a spike in reads. The gap between ideal conditions and real workloads is where subtle bugs hide—indexes that work until they don't, query plans that flip under concurrency, and timeouts that only appear when connection pools are exhausted.
Build your accuracy checks around the actual load profile: peak request rates, read/write mix, payload sizes, and the presence of background jobs. If you run a reporting query at 50 concurrent users in test but production sees 800 with mixed short and long transactions, your accuracy metrics are fiction. Use load generation that matches observed patterns, not a flat synthetic curve. Record real traffic and replay it with variations so the system experiences the same skew and bursts it will face live.
One practical approach is to sample production queries, obfuscate sensitive fields, and run them as a shadow workload against a candidate build. Watch for accuracy drift under sustained load—not just errors, but wrong results that pass basic assertions. A system can return HTTP 200 and still be wrong when a join misses rows under memory pressure or a cache returns stale data. Test until the system fails, then tune, because the first time you see a load-induced accuracy bug should not be from a customer.
Demand Temperature Drift Numbers from Your Supplier’s Own Lab
When a vendor hands you a datasheet with a single temperature drift figure, ask for the raw test logs from their internal qualification bench. Most suppliers already run thermal cycling on every batch, but they only publish the smoothed, best-case number. Request the distribution across at least three lots and the actual chamber profile, not just the ambient setpoint. That mismatch between the reported ppm/°C and what your calibration loop sees often comes from different cold-start conditions or sensor placement, and the only way to pin it down is to see their lab notebook data.
Push for a signed summary that lists drift at -40°C, +25°C, and +85°C for the exact part number you are buying, not a “typical device” from an older revision. If the supplier hesitates, ask for the test procedure number and the equipment list. Legitimate labs can share these without exposing proprietary design details. A refusal usually means the published drift was either taken from a single golden unit or extrapolated from a simulation.
Once you have the supplier's own numbers, compare them against your incoming inspection data over three consecutive shipments. Even a 20% gap between their lab and your board-level measurement can point to a layout issue or a reference voltage interaction. Holding them to their own data is far more effective than quoting an industry standard.
Look Past the Enclosure to How the Secondary Is Shielded
The outer case rarely tells the full story. Lift the lid on a well-built transformer and the real work sits in the secondary winding's shielding arrangement. Instead of wrapping the entire assembly in foil and calling it done, thoughtful designs place a grounded electrostatic shield between primary and secondary. That thin conductive layer blocks common-mode noise from hopping across the isolation barrier, so what reaches the load is already cleaner before any filtering downstream.
Shielding the secondary isn't just about slapping on more copper. The shape, coverage, and termination point all shift the parasitic capacitance and leakage current paths. A shield that floats or ties to the wrong node can invite ringing and compromise isolation ratings. But when the secondary-side shield returns to the correct reference — often the quiet end of the winding or a dedicated pin — voltage transients get steered away from sensitive circuits. The result is less radiated interference and a steadier output even when the incoming line carries spikes.
Get a Winding Resistance Report for Every Delivered Batch
Every delivered batch of transformers or motors comes with a winding resistance test report that logs the measured resistance for each phase. The data is captured at the factory after the windings have stabilized to ambient temperature, and each value is compared against the calculated tolerance band before the unit is cleared for shipment.
The report includes the serial numbers of the tested units, the test date, the instrument used, and the temperature correction applied. If a reading falls outside the expected range, the batch is held and reworked, so the final document you receive represents only the acceptable production run.
Having this report per delivery helps your receiving team verify that the components meet the winding continuity requirements before installation. Instead of chasing down documentation later, the certificate travels with the packing list, making it simple to attach to your quality records.
FAQ
Look for proven experience with specific protection relays, not just generic electrical components. Ask for case studies or references where their RCTs worked with your relay brand, and check if they offer custom core materials for different frequency environments.
Request test reports showing linearity and phase error across the full operating range, not just at rated current. A trustworthy company will share data from secondary injection tests, including behavior under DC offsets or harmonics.
Yes, especially if your installation has unusual cabling or high electromagnetic interference. On-site support often catches errors like poor shielding or incorrect burden resistor selection that would otherwise cause nuisance tripping.
Undersizing the core for the maximum earth fault current, ignoring the relay burden, and overlooking temperature drift. Many engineers also forget to check if the RCT can handle the inrush of non-linear loads without saturation.
At least every two years, or more frequently in harsh environments like coastal or chemical plants. A quick ratio test and insulation resistance check can reveal degradation before it leads to protection failure.
Not always. Relay input impedance and required accuracy class differ. Some digital relays need a specific RCT secondary current or knee-point voltage, so confirm compatibility with the relay manufacturer's specifications.
High-permeability cores like permalloy or nanocrystalline improve sensitivity for small leakage currents, but they saturate more easily. For circuits with large fault currents, a gapped core or special alloy may be needed to preserve linearity.
In circuits with electronic equipment or human contact risk, every millisecond counts. A slow RCT can delay relay tripping, turning a minor earth fault into equipment damage or a serious hazard.
Conclusion
Selecting a residual current transformer supplier is rarely as simple as matching a part number. Start by aligning the residual current range with the fault profile your installation actually produces; low-level leakage demands a transformer that can resolve small signals without drowning in noise. Core material claims deserve scrutiny too. Ask for a saturation curve instead of accepting a vague permeability figure, because the point where the core saturates defines how the unit will behave during a genuine ground fault. Accuracy under ideal, resistive bench loads is not enough—request test data from loads that mirror your real operating conditions, including non-linear and reactive components.
Thermal behavior is another make-or-break factor. Demand temperature drift numbers generated in the supplier's own lab, not copied from a generic brochure, since drift can quietly compromise residual current measurement. The enclosure might feel sturdy, but the real protection comes from how the secondary winding is shielded against electromagnetic interference; a metal shell alone won't keep out field noise. Finally, insist on a winding resistance report for every delivered batch. That single document reveals manufacturing variation that could lead to nuisance tripping or missed faults. Together, these practices shift the selection process from a paperwork exercise into an actual safeguard for electrical protection.
Contact Us
Contact Person: Liu Mengyang
Email: [email protected]
Tel/WhatsApp: 8618727589233
Website: https://www.cnlrm.com/en/